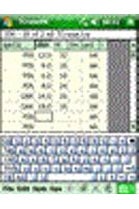
 Real Time Inventory (RTI) System, is the first and only fully integrated portable Global Positioning System (GPS), Geographic Information System (GIS) and Forestry Field Inventory solution on the market. RTI is the integration between Haglof’s field inventory software, TCruise, and Trimble’s GPS data collection/verification software, SOLOForest. It is the only forestry solution that allows you to collect both GPS and forest inventory data on the same data collector and integrate the two in the field.
Creating a plot with RTI is extremely fast and simple. Here are all the steps you’ll need.
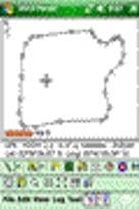
- Create a Stand Boundary. This can be done in the office or field by digitizing on a photo, or by using our GPS systems to traverse the stand in question.
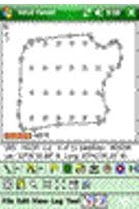
- Create a Cruise Grid. In the office or field, you can specify the grid spacing and orientation and even begin the grid 1/2 the distance over and up from a known corner.
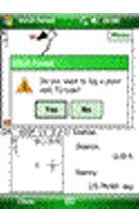
- Navigate a Plot. Select a plot you want to go to and use GPS to navigate there. When you get within a specified distance from the plot center, SOLOForest will automatically alert you that you are near plot center and ask you if you want to collect data with TCruise.
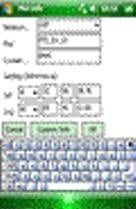
- Enter Plot Data. If you answer “YES”, a link will be established between SOLOForest and TCruise, the plot ID, Lat./Long., Stratum and Cruises will be sent to TCruise, and you will be automatically “switched” to TCruise. You can then enter Plot Level Info and go to the data entry screen to enter tree data.
- Enter Tree Data. Tally the trees and save the plot in TCruise. You can enter trees in a tally card or spreadsheet format, both of which have your species, products, and merchandising specs built in to them. Your products will be automatically assigned by dbh unless you override and assign them manually.
- Do It Again! After finishing your first plot, simply go back to SOLO Forest, select the next plot and keep going.
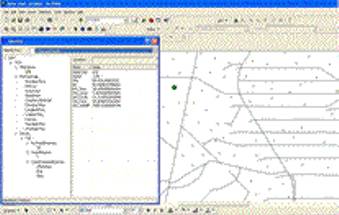 Back in the office:
Shapefiles are exported directly out of SOLO Forest, transferred to the PC, and then imported into ArcGIS or other GIS programs. TCruise plot data is also a simple copy/paste operation back on your PC. Process your cruise data using TCruise Desktop and then output standard customized reports. Your TCruise data can also be exported to an Access mdb that can be easily joined to your visited plot data in your GIS.

